Research and Computational Thinking

Primary Research
Below is the information for primary research, we used the 6th grade survey as an example to show and describe each question.

Primary research (ex. grade 6 survey)
This question is to help us narrow down our research a bit more and get more specific data. In our school, sixth grade had three different teams, 6-1, 6-2, and 6-3. We asked this question so we could see which teams took this survey.
Primary research (ex. grade 6 survey)
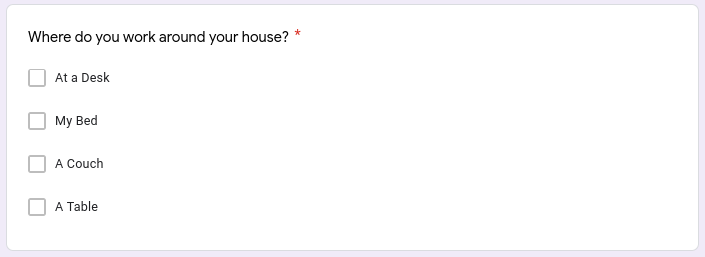
This question was to help us know where we have to make the prototype adaptable to. Since people work at different areas around the house, we wanted to know where most people do online school to make it most adaptable to that area.
Primary research (ex. grade 6 survey)
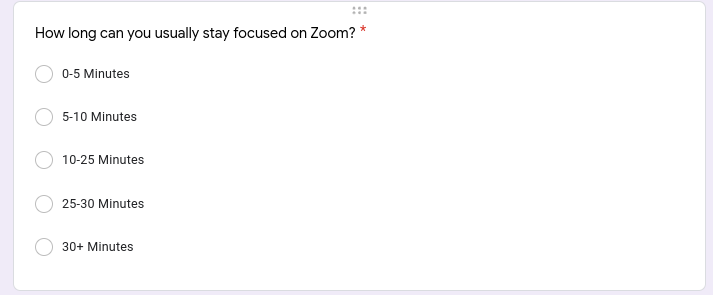
This question was to help us get an idea of how long they could stay focused before the product. With this question, we also get an idea of how much time it takes a student to disengage from their classes.
Primary research (ex. grade 6 survey)
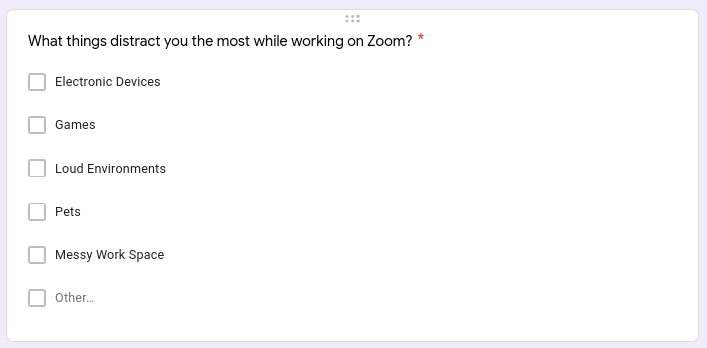
This question was to help us figure out what we might need to add into our prototype to lessen these distractions. This also helps us figure out what these distractions are.

Primary research (ex. grade 6 survey)
This question was for us to know if we should have a specific place for everything in our prototype to help people be organized. Being more organized can help students focus more while learning online.

Primary research (ex. grade 6 survey)
This question was to help us confirm that a lot of students have trouble engaging on zoom. This will also give us an idea of how many students stay focused on zoom.
Primary research (ex. grade 6 survey)
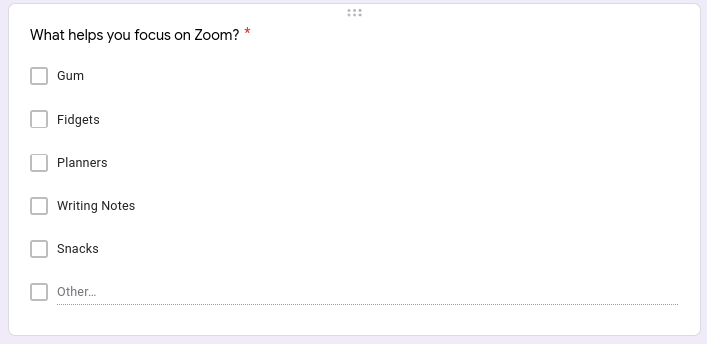
This question was to help us figure out what we might need to add into the prototype to make it better to help students stay focused in their classes.

Below is the data and data analysis from our 6th grade surveys.
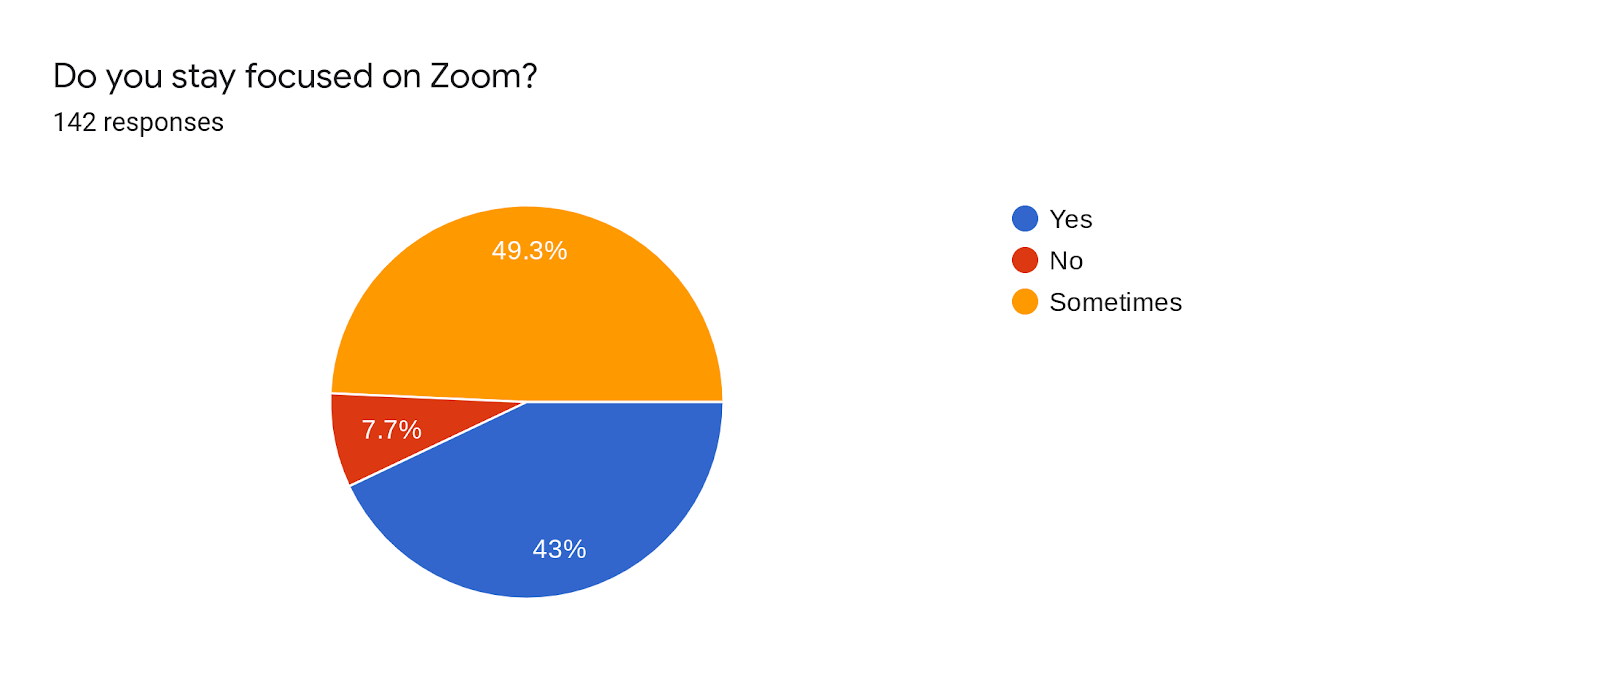
Data Analysis and Visual Data (grade 6)
The question was "Do you stay focused on zoom?" 43.9% of the sixth graders said they stayed focused sometimes and 7.7% said they don't stay focused on zoom. This gives us an idea of the amount of people that we would be marketing to. This also confirms that students do get distracted while being on zoom.
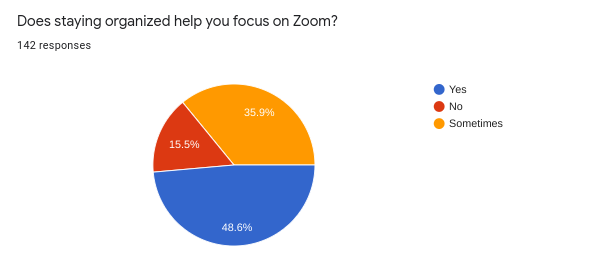
Data Analysis and Visual Data (grade 6)
The question was "Does staying organized help you stay focused on zoom?" 49.3% of the sixth graders said "sometimes" and 43% said "yes". This confirms that being organized helps students stay focused on zoom. This also gives us the idea that we should make a little compartment to keep stuff organized. (ex. putting pockets to keep specific thing in).
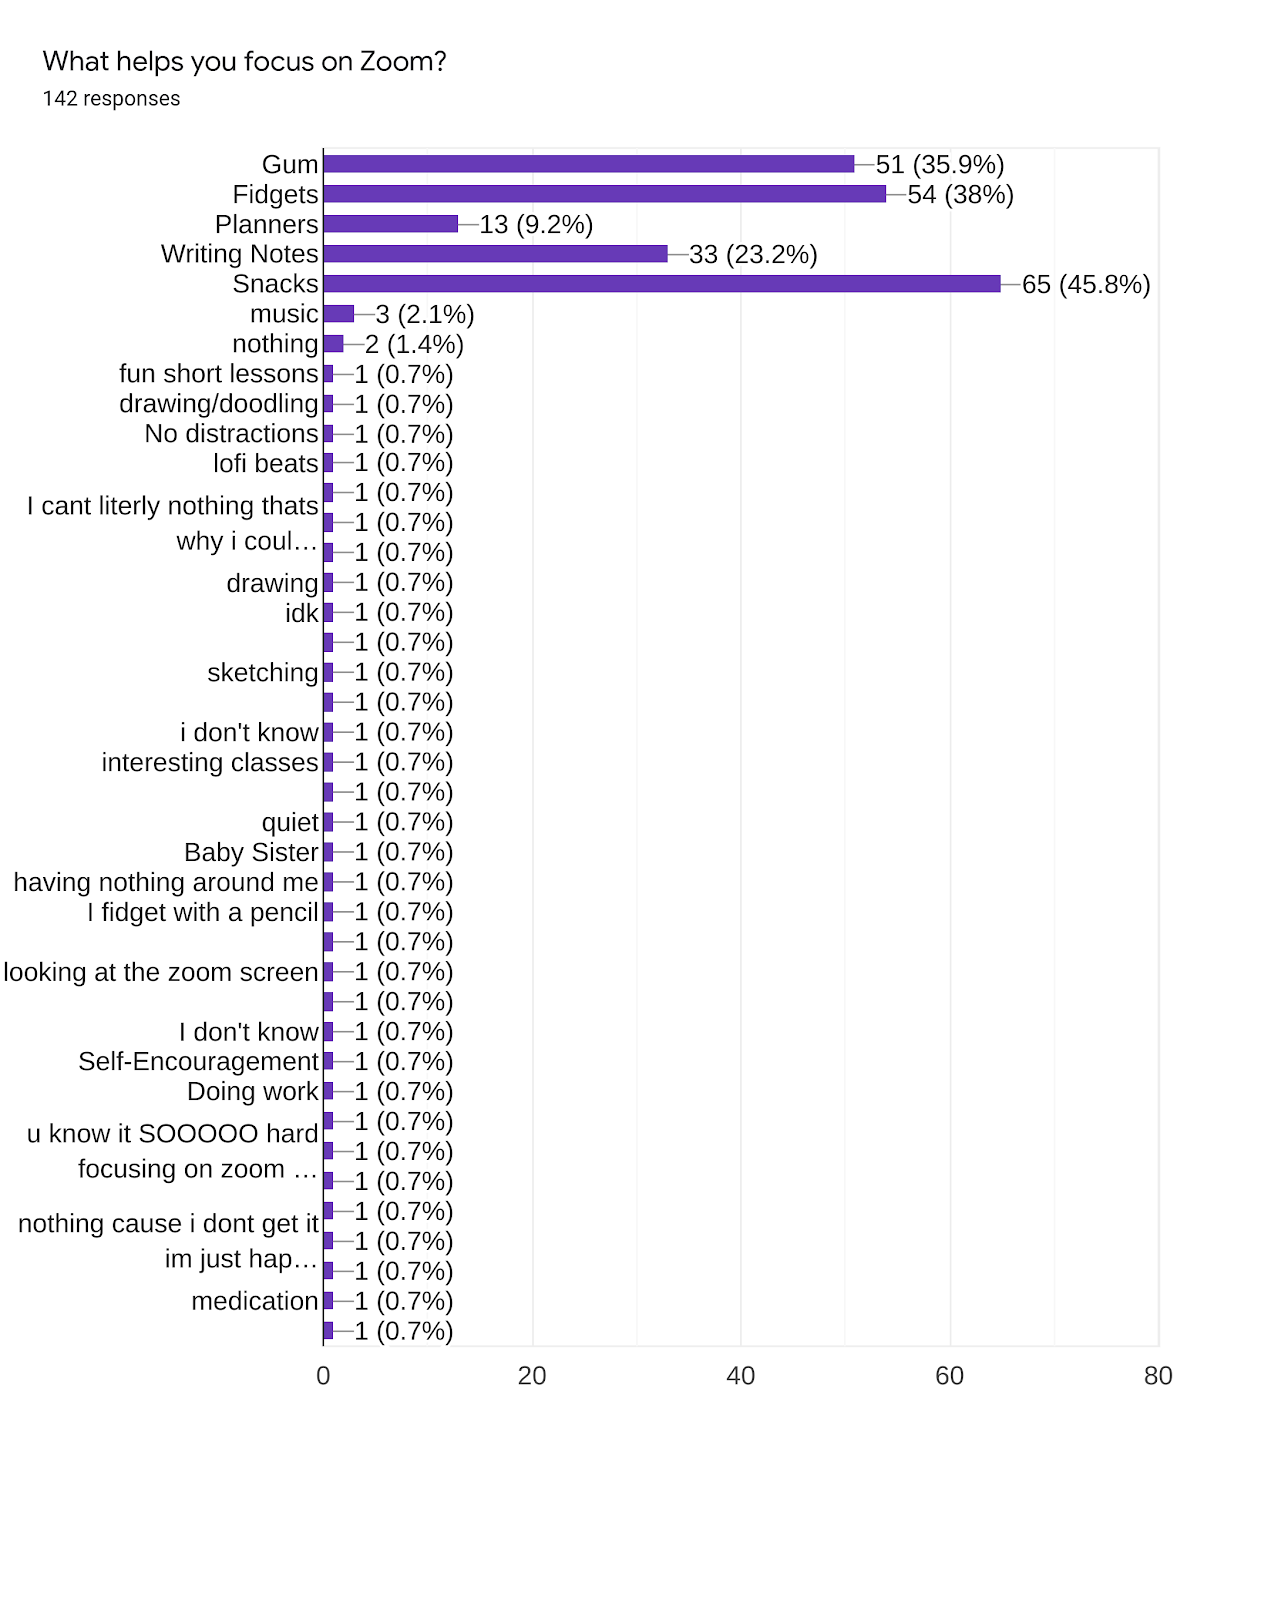
Data Analysis and Visual Data (grade 6)
The question was "What helps you stay focused on zoom?" 45.8% of students said snacks help them focus and 38% said fidgets help them focus. This gives us an idea of what we might need to add in our prototype, for example, a place to hold snacks or something to fidget with while doing online classes.
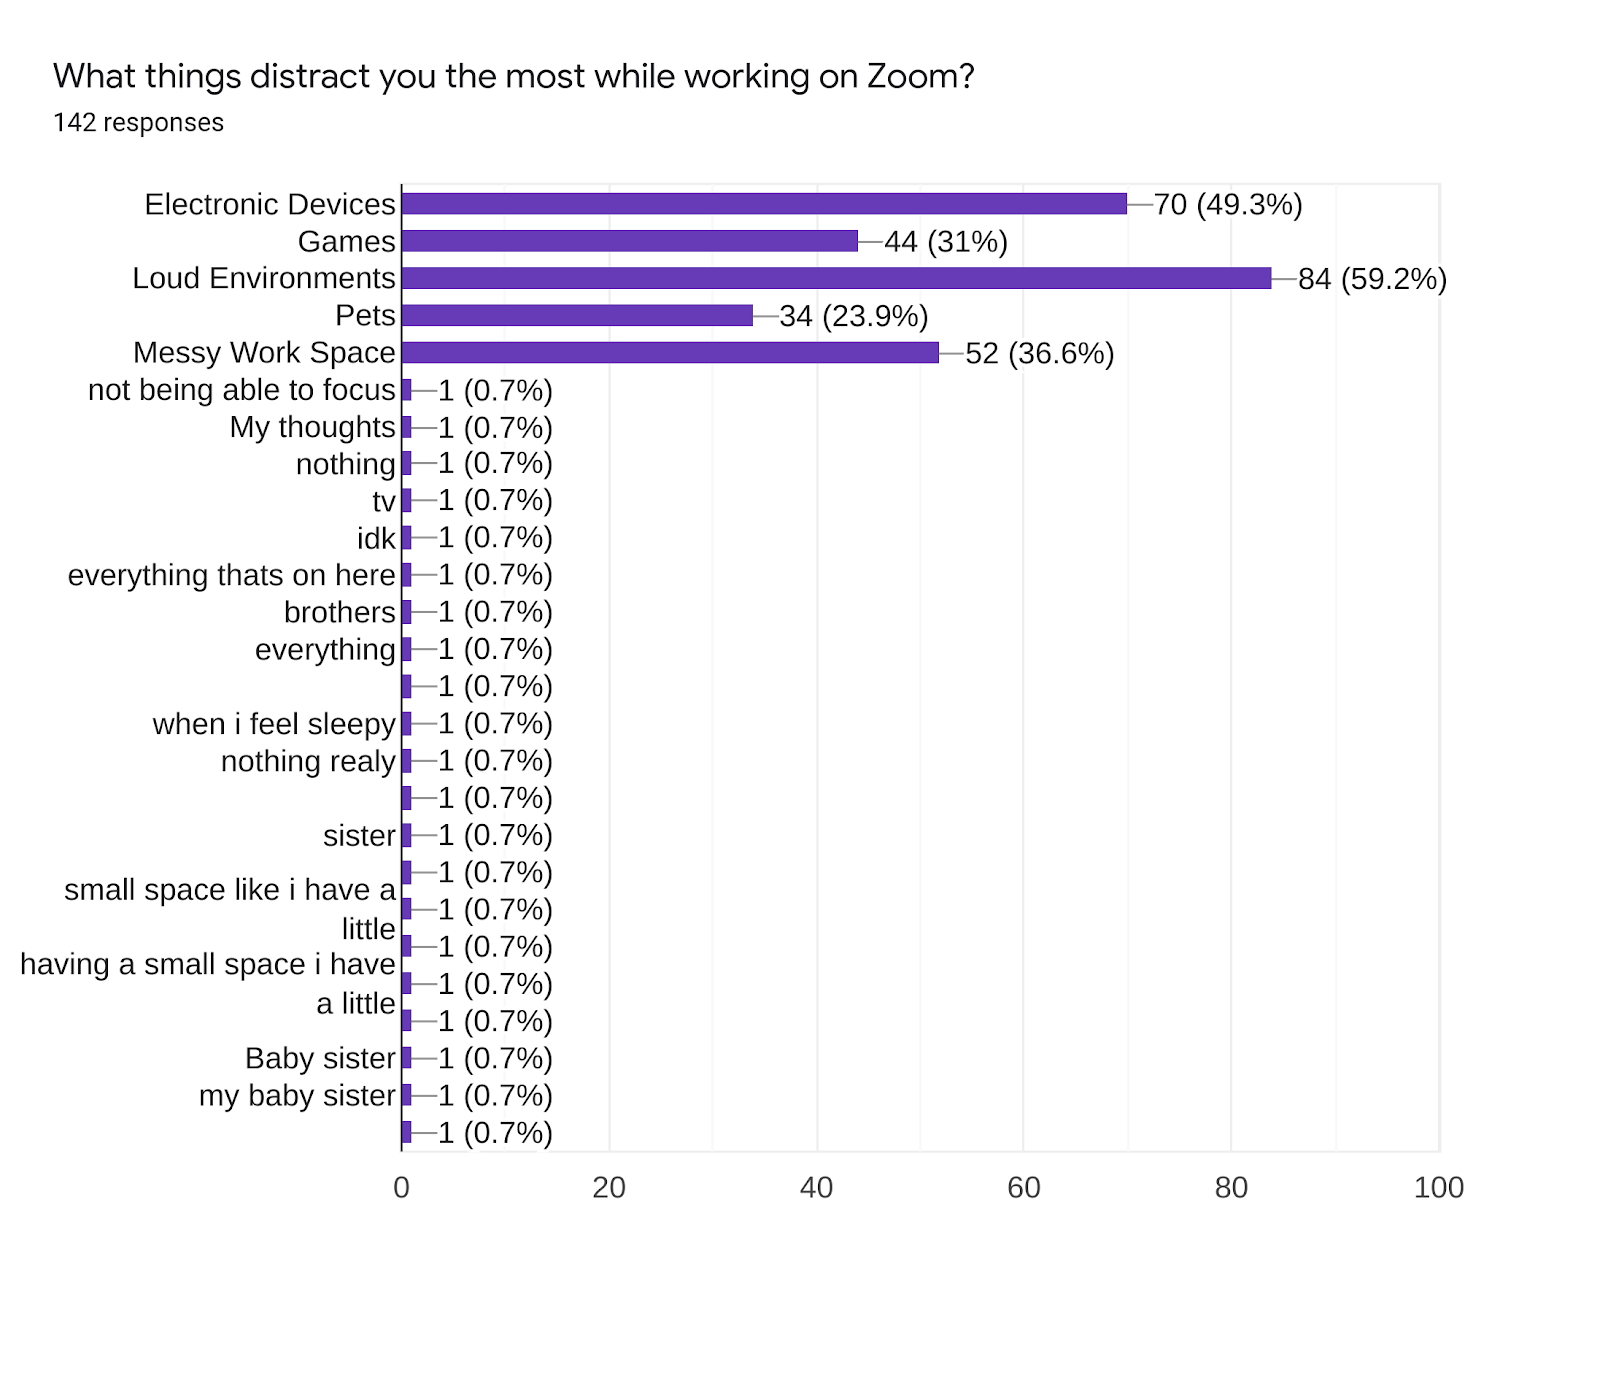
Data Analysis and Visual Data (grade 6)
The question was "What things distract you the most while learning on zoom?" 59.2% of sixth graders said that loud environments distract them the most and 49.3% said electronic devices distract them. This gives us an idea of the environment the prototype will need to adapt to.
Data Analysis and Visual Data (grade 6)
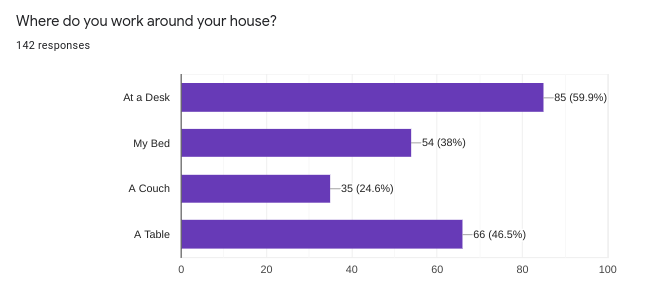
The question was "Where do you work around you're house?" 59.9% of sixth graders said they worked at a desk when learning online. 38% of sixth graders said they work on their bed when learning online. This gives us an idea of what surfaces we have to make our prototype accessible to.

Below is the data and data analysis from our 7th grade surveys.
Data Analysis and Visual Data (grade 7)
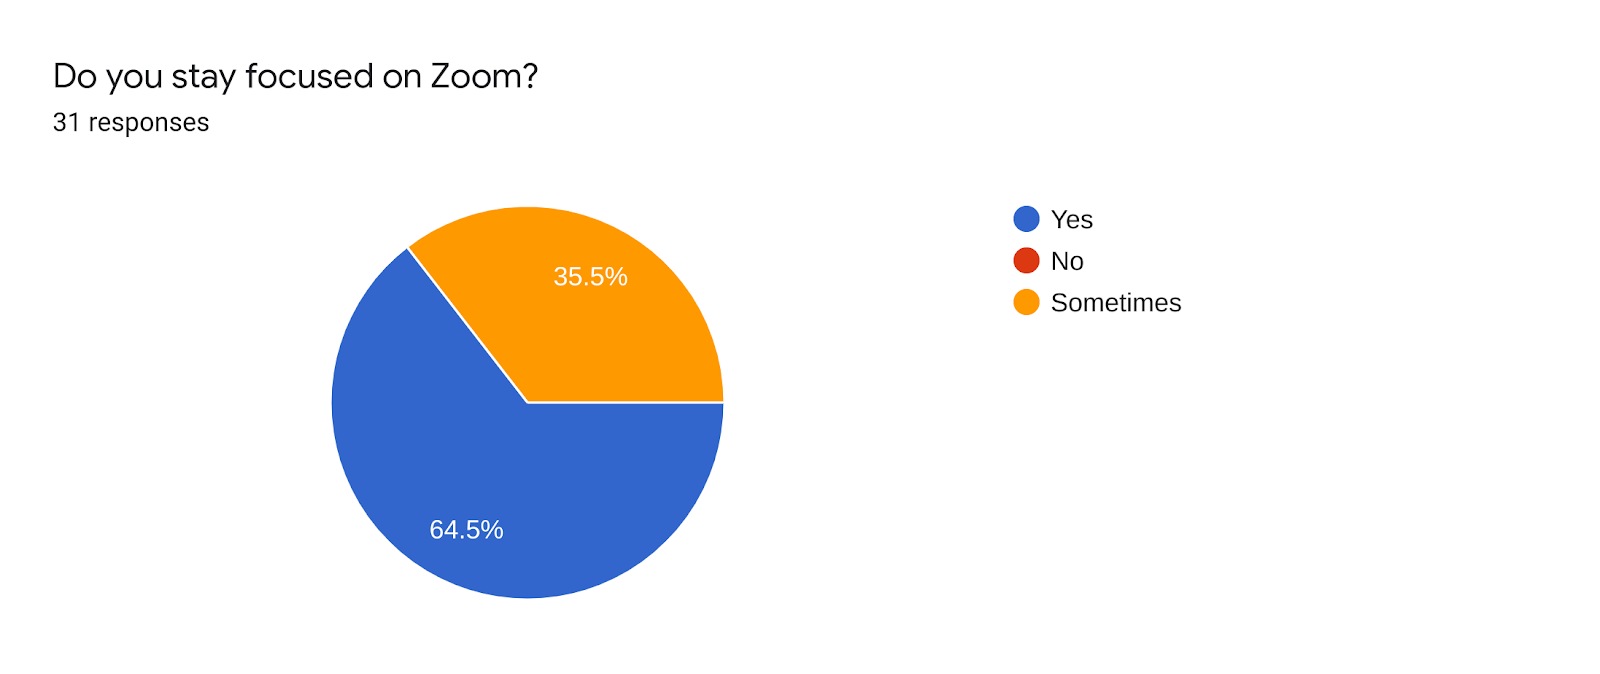
The question was "Do you stay focused on Zoom?" 64.5% of the 7th graders that took the survey said yes. 35.5% of students said sometimes. This gives us an idea of the amount of people that we would be marketing to.
Data Analysis and Visual Data (grade 7)
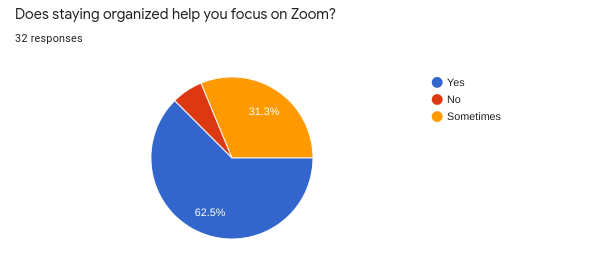
The question was "Does staying organized help you focus on Zoom?" 62.5% of the 7th graders that took the survey said "yes". 31.3% 7th graders said "sometimes". 6.2% said "no". This gives us the idea that we should organize thing in the prototype (ex. putting pockets to keep specific thing in).
Data Analysis and Visual Data (grade 7)
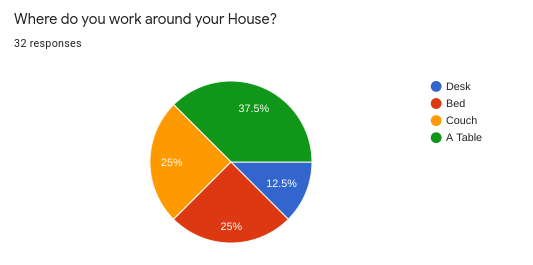
The question was "Where do you work around your house?" 37.5% of the 7th graders that took the survey said "A table". 25% of students said "A bed". 25% of 7th graders said "A couch". 12.5% of 7th graders said "A table". This gives us an idea of what surfaces we have to make our prototype accessible to.
Data Analysis and Visual Data (grade 7)
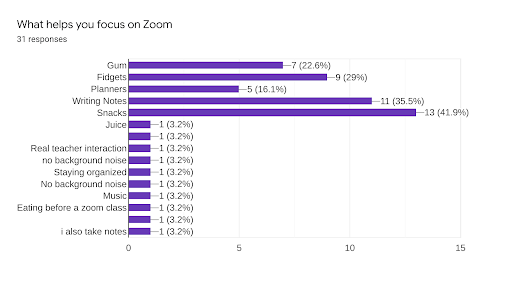
The question was "What helps you focus on Zoom?" 41.9% of the 7th graders that took the survey said "Snacks". 35.5% of students said "Writing Notes". 29% of 7th graders said "Fidgets". 22.6% of students said "Gum". 16.1% of students said "Planners". This helps us determine what we would need to include in our product to help the students focus.
Data Analysis and Visual Data (grade 7)
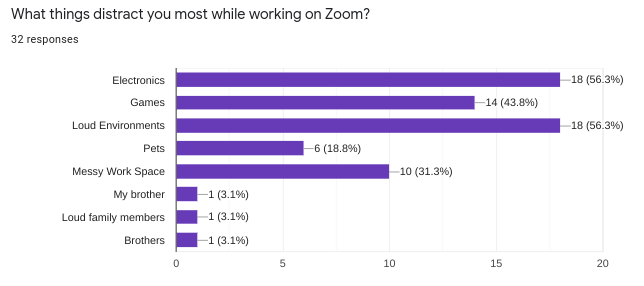
The question was "What Things distract you most while working on Zoom?" 56.3% of the 7th graders that took the survey said "Electronics". 56.3% of students said "Loud Environments". 43.8% of 7th graders said "Games". 31.3% of students said "Messy Work Space". 18.8% of students said "Pets". This gives us an idea of the environment the prototype will need to adapt to.

Below is the data and data analysis from our 8th grade surveys.
Data Analysis and Visual Data (grade 8)
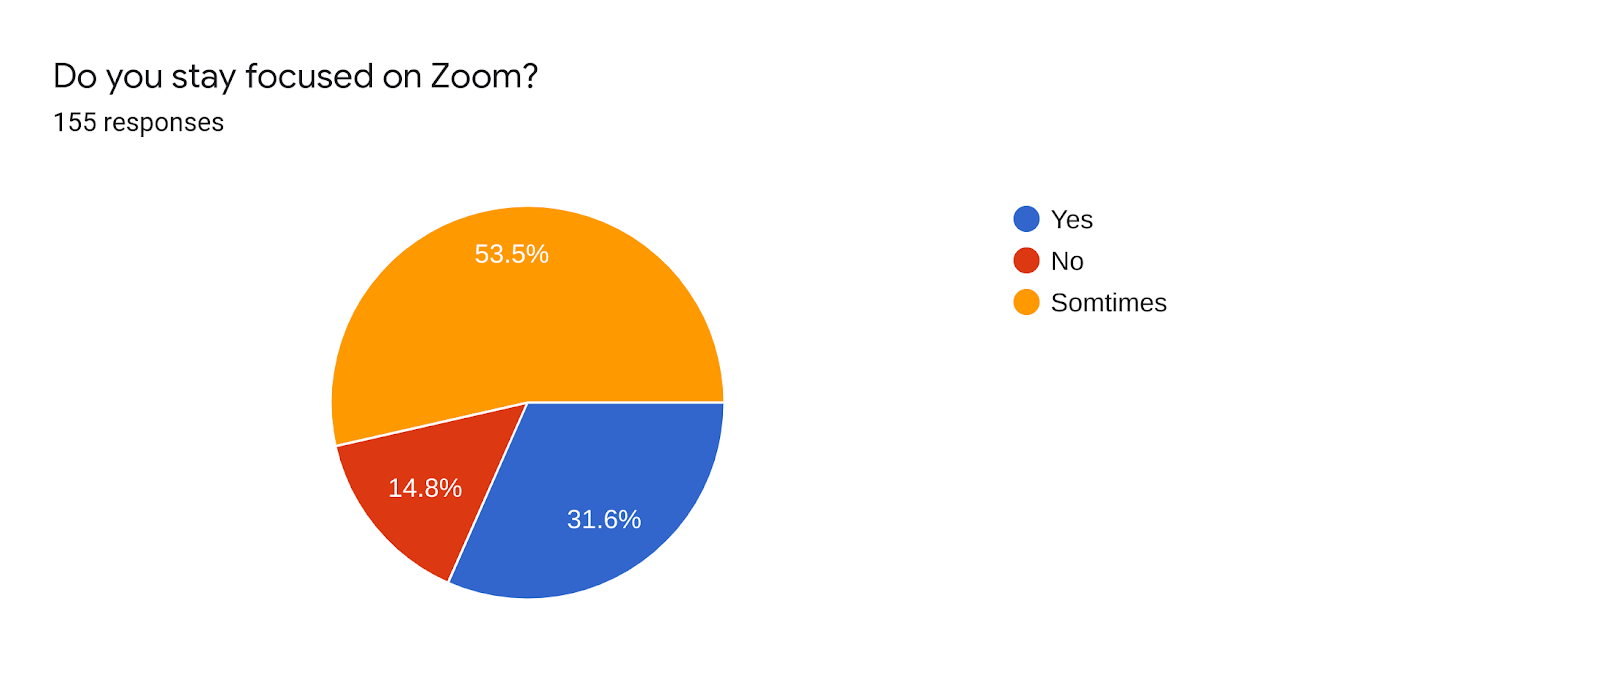
After asking the question, "Do you stay focused on zoom?" 53.5% of students responded with "sometimes" and 31.6% responded with "yes" and 14.8% responded no. This tells 68.3% of students have trouble focusing on zoom at some point.
Data Analysis and Visual Data (grade 8)
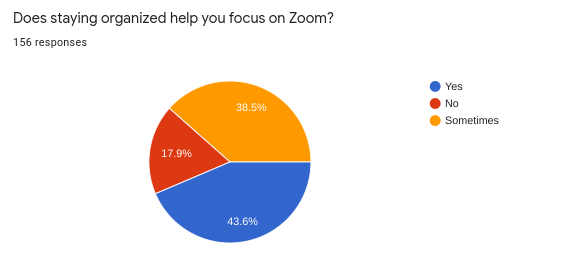
After studying our survey results, we came to the conclusion that 8th graders find organization helpful during zoom class. Since 43.3% of 8th graders said "Yes" and 38.5% of students responded with "sometimes" to our survey, which asked if being organized keeps kids focused on zoom, we had the idea of organizing things in the prototype (ex. putting pockets to keep specific things in).
Data Analysis and Visual Data (grade 8)
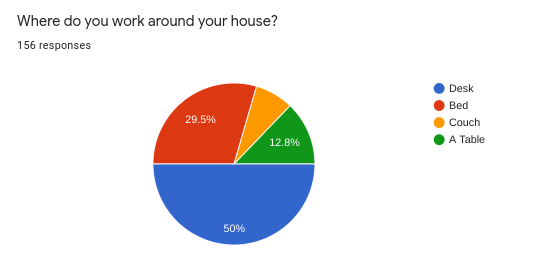
The question was"Where do you work around your house?" 50% of students said that they work on a desk and 29.5% said they work on a bed. This gives us a good idea of the surface and structure our prototype should be accessible to.
Data Analysis and Visual Data (grade 8)
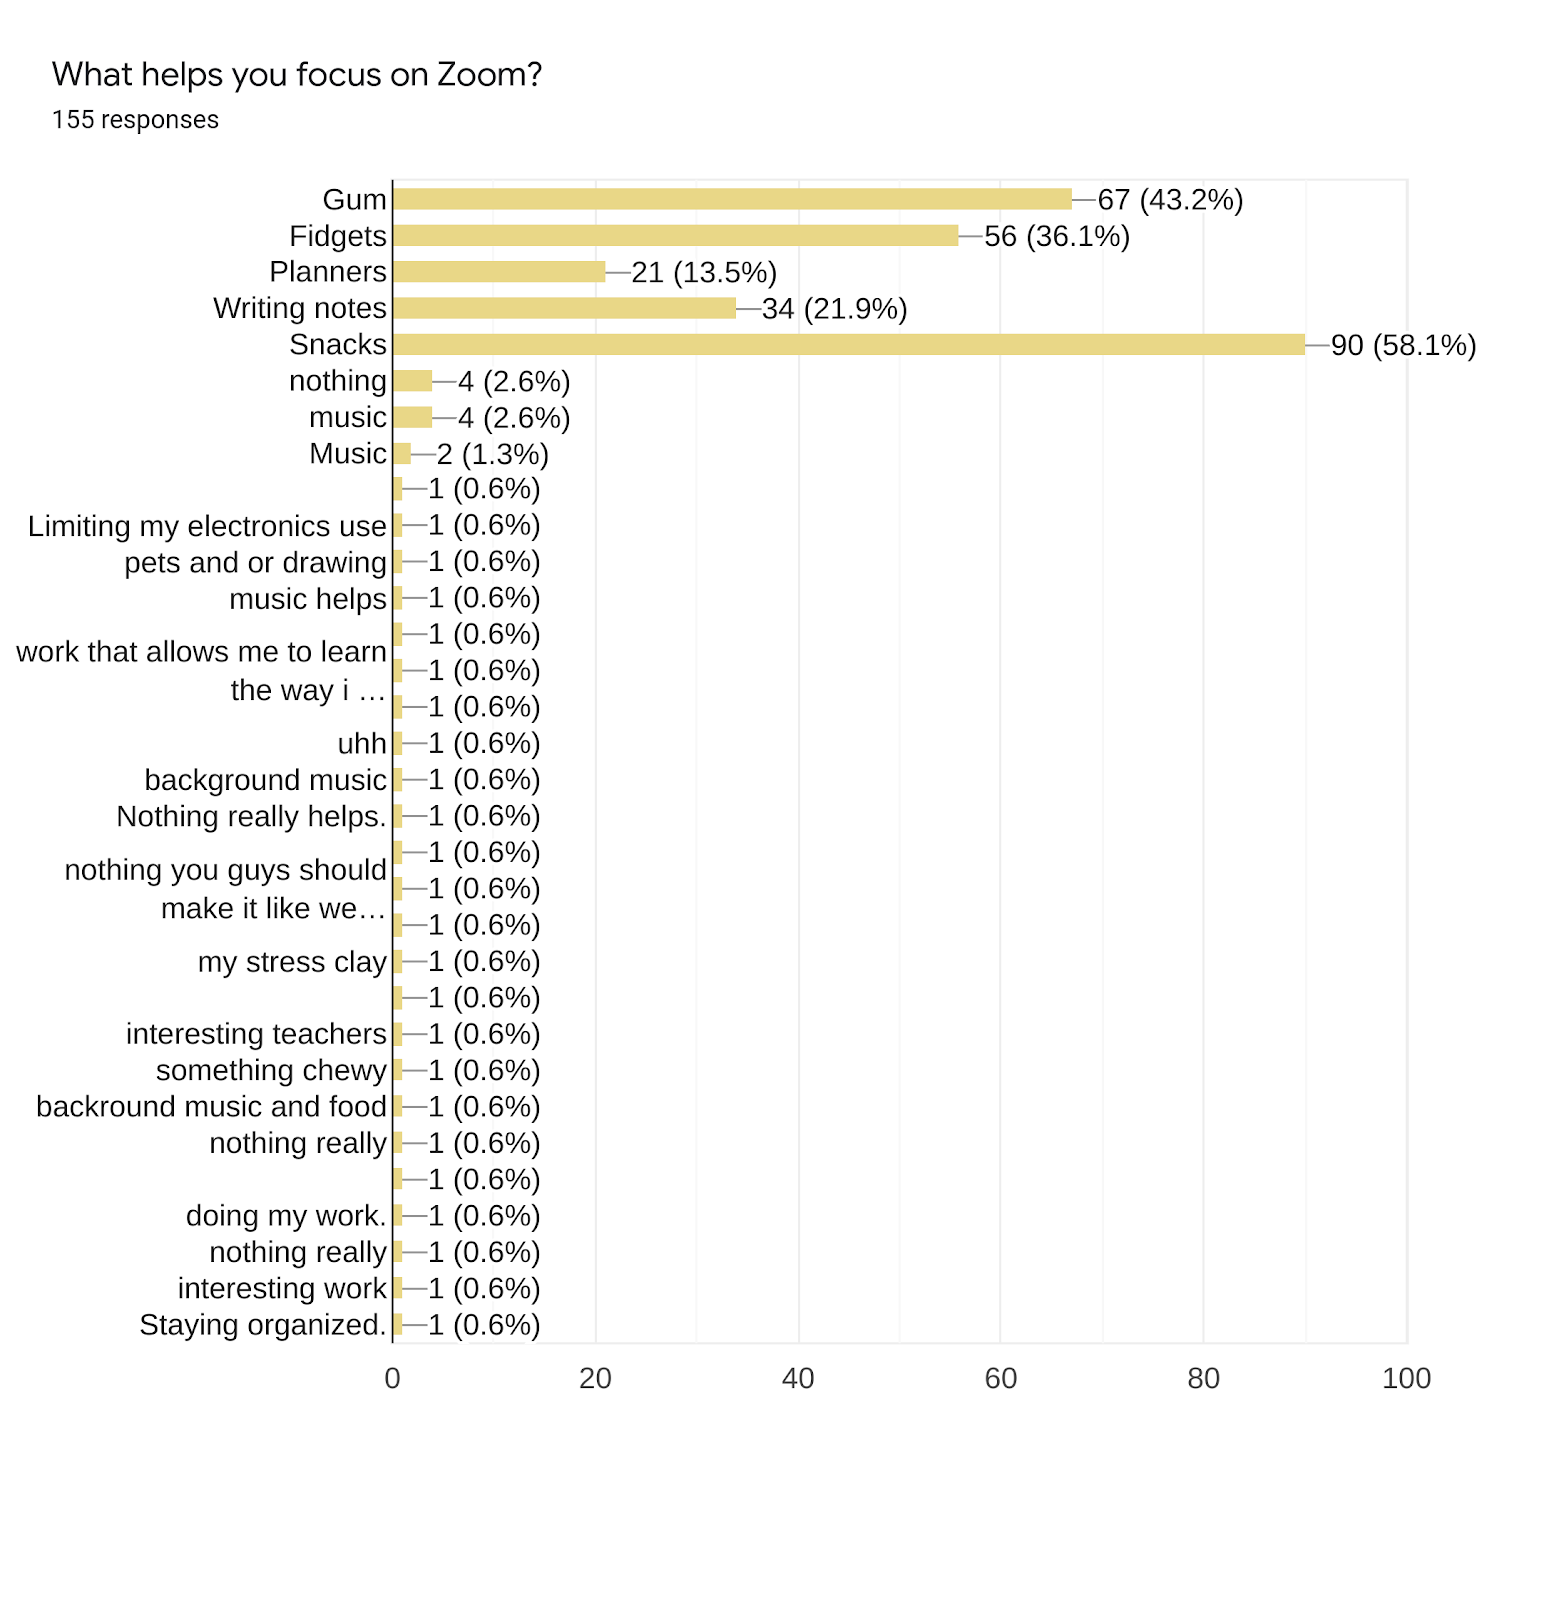
We asked the question "What helps you focus on zoom?" to 8th graders. Our research concluded that the 58.1% of 8th graders focus better with "Snacks", 43.2% said "Gum", and 36.1% said "fidgets" This gives us an idea of what we might need to add in our prototype.
Data Analysis and Visual Data (grade 8)
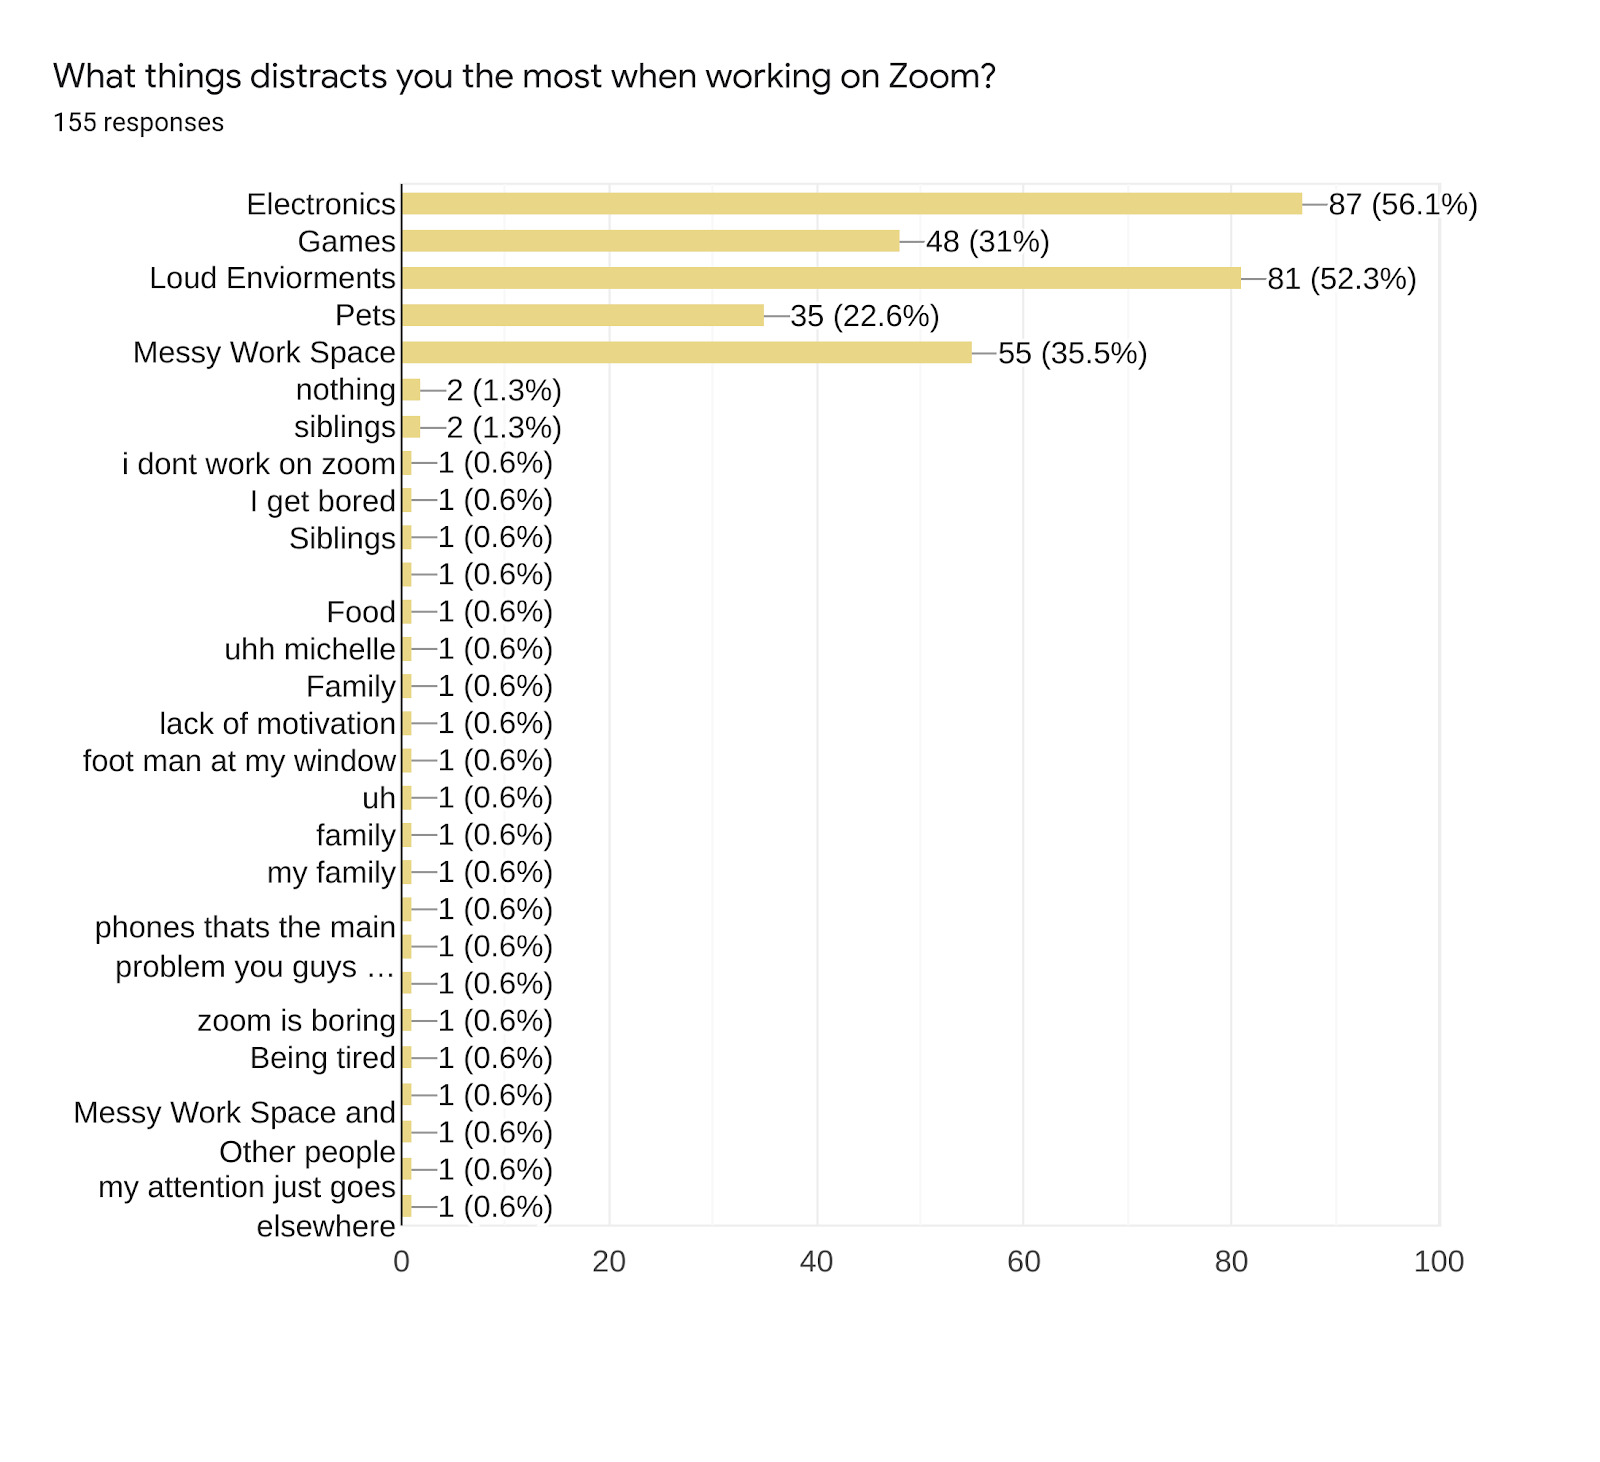
The question was "What things distract you the most when working Zoom?" 56.1% responded with "Electronics." 52.3% said "Loud Environments" and 35.5% said "Messy Work Spaces." This gives us an idea of the environment the prototype will need to adapt to.

Secondary Research
This section is where initial research was studied and analyzed to best determine what the research team should do moving forward.
The following sources were used to determine how to approach our situation.